BTrace allows users to dynamically instrument running Java application using special Java annotations. Annotations act as directive to indicate where tracing code should be inserted in the target application.
For example you can insert code (tracing/debug) print all arguments to a method or print information whenever particular method is called along with caller information using stack trace.
All this can be done at runtime without requiring any source code changes to target application or restarting target application.
Here is how it works
At high level you write Java source file using the framework provided by the BTrace which allows you to print arguments ,trace method calls. When user executes external BTrace annotated Java code using BTrace client, it creates and invokes an agent in the target JVM ( through the Attach API ) and then it uses client to communicate with that agent to perform instrumentation.
This technique is similar to aspect oriented programming using aspectj where you write aspects in external file and use aspectj compiler to weave byte code.Advantage of using BTrace is , you are changing byte code in running application.
How to Use BTrace
BTrace provides command line tool and plugin to Visual VM tool ( Visual VM is part of JDK release ).
In this blog post I will show you how to install and use BTrace plugin in Visual VM.
Visual VM is part of JDK since 6.0. You can also download from java.net.
Launch Visual VM and select “Tools\Plugins” option in Menu bar.
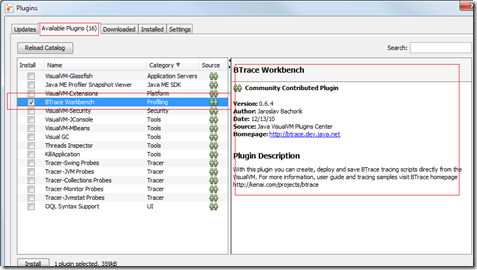
In the plugins dialog , select “Available Plugins” tab. One of the option listed is “BTrace workbench”. If it is not listed enter , “BTrace” in search box.
Note: To get the available list of plugins ,make sure that you are connected to internet and proxy configuration is proper.
In the plugin dialog select “BTrace workbench” and install. Restart the Visual VM application so that newly installed plugin is loaded.
Once you restart the Visual VM , it will show all the running java application on your machine. In my case I am running “Notepad” demo application which ships with JDK demos ( JDK_HOME\demos\jfc\Notepad ).
Select the Notepad application , right click and select “Trace application…” from the menu, as show below.
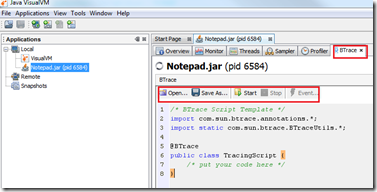
Once “Trace application” option is selected following dialog pops up to allow user to enter java code trace “Notepad” application.
Now lets trace all the files opened for reading/writing by “Notepad” application. Remove the existing code from the window and copy/paste following code.
This is the sample code from code from BTrace library , which allows to trace file open for read/write.
/* BTrace Script Template */
import com.sun.btrace.annotations.*;
import static com.sun.btrace.BTraceUtils.*;

import java.io.File;
import java.io.FileInputStream;
import java.io.FileOutputStream;

/**
 * This sample prints all files opened for read/write
 * by a Java process. Note that if you pass FileDescriptor
 * to File{Input/Output}Stream or File{Reader/Writer},
 * that is not tracked by this script.
 */
@BTrace public class FileTracker {
    @TLS private static String name;

    @OnMethod(
        clazz="java.io.FileInputStream",
        method="<init>"
    )
    public static void onNewFileInputStream(@Self FileInputStream self,
                                            File f) {
        name = Strings.str(f);
    }

    @OnMethod(
        clazz="java.io.FileInputStream",
        method="<init>",
        type="void (java.io.File)",
        location=@Location(Kind.RETURN)
    )
    public static void onNewFileInputStreamReturn() {
        if (name != null) {
            println(Strings.strcat("opened for read ", name));
            name = null;
        }
    }

    @OnMethod(
        clazz="java.io.FileOutputStream",
        method="<init>"
    )
    public static void onNewFileOutputStream(@Self FileOutputStream self,
                                              File f, boolean b) {
        name = str(f);
    }

    @OnMethod(
        clazz="java.io.FileOutputStream",
        method="<init>",
        type="void (java.io.File, boolean)",
        location=@Location(Kind.RETURN)
    )
    public static void OnNewFileOutputStreamReturn() {
        if (name != null) {
            println(Strings.strcat("opened for write ", name));
            name = null;
        }
    }
}
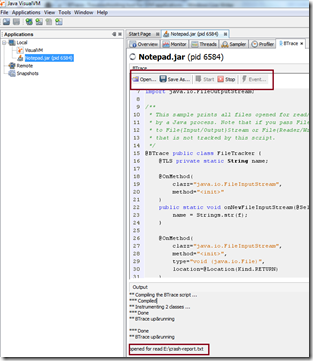
Select “Start” option . Now try to open any file in Notepad application or create new file , you will see trace message printed in the output windows shown below.
More samples available in BTrace User guide
Using Command Line version
BTrace also ships with command line tool which allows you debug/trace target application. From the command line you can use btrace client tool to trace Java application
btrace <target-java-pid> FileTracker.java
BTrace ships with number of sample application that shows various BTrace features. Download the sample application from the btrace website
Resouces
2. BTrace user guide ( user guide as number samples which demonstrate capbaility of BTrace ).
4. BTrace wiki.


